Our Paediatric workforce information page has an overview of this information along with other workforce and service data; this is regularly updated as and when new data are released.
England - consultants
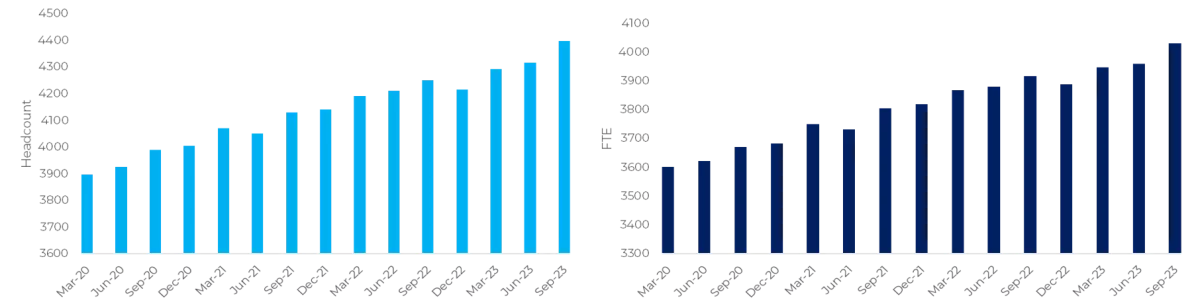
Between March 2020 and September 2023, Consultant headcount increased by 12.9% from 3897 to 4316. This increase was essentially linear and incremental across each quarter.
This same trend is mirrored in the FTE (full time equivalent) data whereby the number of FTE is on average 300-400 lower than that of headcount indicating that the proportion of those working less than full time has remained consistent.
Year-on-year consultant headcount and FTE data per region shows a similar trend for each of the England NHS Trust regions with incremental increases across the three years (2020-23).

England - SAS doctors
The pattern for SAS doctors is noticeably different from that of consultants. From March 2020 to September 2023 the headcount increased 3.3% from 700 to 723, but during this time numbers periodically declined eg between March 2020 and March 2021 and increased eg from December 2022 to June 2023; most recently, numbers have dropped slightly.
Again, this trend is mirrored in the FTE data; the number of FTE is on average 100 lower than that of headcount indicating that the proportion of those working less than full time has remained consistent

Year-on-year data per region shows that there is a trend that remains consistent for 2020 and 2021 across all seven NHS Trust regions, but with a significant increase in 2022. By 2023, the numbers fell considerably.

Scotland - consultants
From March 2020 to June 2023, consultant headcount increased almost ten percent from 382 to 419. This was essentially linear with incremental increases every quarter. There was, however, a small spike in March 2021 whereby headcount increased by 6%.
This trend is mirrored in the FTE data, which is similarly linear across the three years, again with a concomitant spike of 5.7% and again indicating that the proportion of those working less than full time has remained consistent.

When looking at data year on year, there has been a variable pattern according to region. Fife, for example, displays decreases over time, while Greater Glasgow and Clyde, Lanarkshire and Grampian have shown increases; Lothian and Tayside have remained largely consistent.

Scotland - SAS doctors
The pattern for SAS doctors is noticeably different from that of consultants. From March 2020 to June 2023, headcount dipped considerably in the second half of 2020, for example, between June 2020 and June 2021 headcount fell by 7.5%, before slowly rising throughout 2021. More recently, there was a linear increase over the second half of 2022 with a substantial increase from March to June 2023; for example between June 2022 and June 2023, headcount rose by 9.9%.
Again, this trend is mirrored in the FTE data with FTE numbers around 20 less than headcount in absolute terms.

Year-on-year data shows a variable pattern according to region with Lothian and Tayside, for example, displaying decreases in SAS doctors over time, while Greater Glasgow and Clyde, Fife and Highlands have seen increases. Ayrshire and Arran and Dumfries and Galloway saw an uplift in 2022-3. No SAS doctors were identified in either Borders or Shetland.

Wales - consultants
From March 2020 to June 2023, consultant headcount initially increased, but then remained largely constant from December 2020 to September 2022, after which there was an increase of 5% between September 2022 and June 2023. This trend is mirrored in the FTE data where the number is on average 20 less than headcount in absolute terms, suggesting that less-than-full-time working has remained largely consistent over this period

When looking at data year on year, there have been increases across many of the Health Boards between June 2020 and June 2023; this is most notable in Betsi Cadwaladr and Cardiff and Vale. Meanwhile, consultant headcount has largely remained consistent for Swansea, Hywel Dda, Powys and Public Health Wales.

Wales - SAS doctors
The number of SAS doctors has steadily increased from March 2020 to June 2023 with an overall increase of 15%. However, it should be noted that the absolute numbers are relatively small. At its lowest level, in June and September 2020 there were 81 SAS doctors, peaking at 100 in March 2023.
This trend is mirrored in the FTE data where the number is on average ten less than headcount in absolute terms, suggesting again that less-than-full-time working has remained largely consistent over this period.

When looking at data year on year, there is variation in the pattern of change in numbers across regions. For example, both Betsi Cadwaladr and Cardiff and Vale saw a dip in numbers between 2020 and 2021, before an upsurge in 2022 and 2023; with Hywel Dda following a similar pattern. Cwm Taf Morgannwg, meanwhile saw a notable jump in numbers from 2020 to 2021 which has remained stable, while for Swansea Bay numbers decreased overall.
